


Creating a Nautical Chart from the Ground Up Using Historical and Manual Methods
AKA
How I learned to forget the PING and love the LEAD LINE

Purpose (THIS SECTION IS A WORK IN PROGRESS!!!)
“We stand on the shoulders of giants” is a quote that I always live by. When learning about Hydrography it always annoyed me that a slide or sentence would be spent on “In the past they used lead lines and now we have electronics and computers so our data is better” It annoys me because it is more than that! They didn’t just use lead lines, and these old techniques were used and perfected for hundreds of years before we had all of our fancy electronics. There data wasn’t worse than ours!
It has been my goal to research and replicate a hydrographic survey using as many manual techniques that I can. I spent months on months researching and practicing the techniques that I found from all over the globe. What better place to test my manual survey than the Hauge a body of water right outside my door.

The Rules For This Project
To try and be as accurate and true to the idea of doing a manual survey that historically accurate I gave myself the below rules
Start with a blank paper
Use my own hands and brain
Use only manual methods and tools (1)
Manual = not “electronic” or modern computer based
Manual example: Magnetic Compass, Simple Theodolite (adjusted by hand), Sextant, Lead Line, Pen & Pencil, Ruler, ect. (2)
Not Manual example: GPS, Sonar, laser range finder, ect.
Methods primarily from Coast and Geodetic Survey
Can’t just make things up cause I feel like this might be a better idea. All these techniques and tools have been recorded for a reason.
Nautical Chart needs to be as accurate as possible
While I do not intend to sail on this chart I want to make sure that I understand the limitations of the data so making sure I do everything as accurate as a I can will ensure I understand the limits of the techniques and tools.
(1) if manual method not available use next most manual method
(2) I did end up utilizing a python script to perform some basic geodetic and survey math. However, to make it “manual” I did not use any python libraries[besides the Math library] and built out all the math for the script myself. I consider this still in the spirt of the project, but if anyone disagrees I would love to hear and I will go back and crank out the math by hand.

(INSERT CITATIONS HERE)
The four simple steps to making a nautical chart
Based upon my experiences and research I have broken down the creation of a nautical chart into the following four “simple” steps.
Planning
Land Survey/Shore Line Survey
Hydrography
Cartography

Land Survey/Shore Line
Point ONE (base station)
Triangulation
Shore Line Survey

A single point (The Base Station)
The one electronic point… This is cheating but if I did it the hard way I would have had to do celestial observations, and all this other stuff that I did not have time to learn and still am learning. The concept is still the same, occupy a point, look at the sky and reference stuff, do this over and over again until you are pretty dang sure you know where you are
Triangulation
Shore Line

Hydrography
Video on how to do horizontal sextant with the lead line and shore person here:
VIDEO
need to add why I did all this stuff
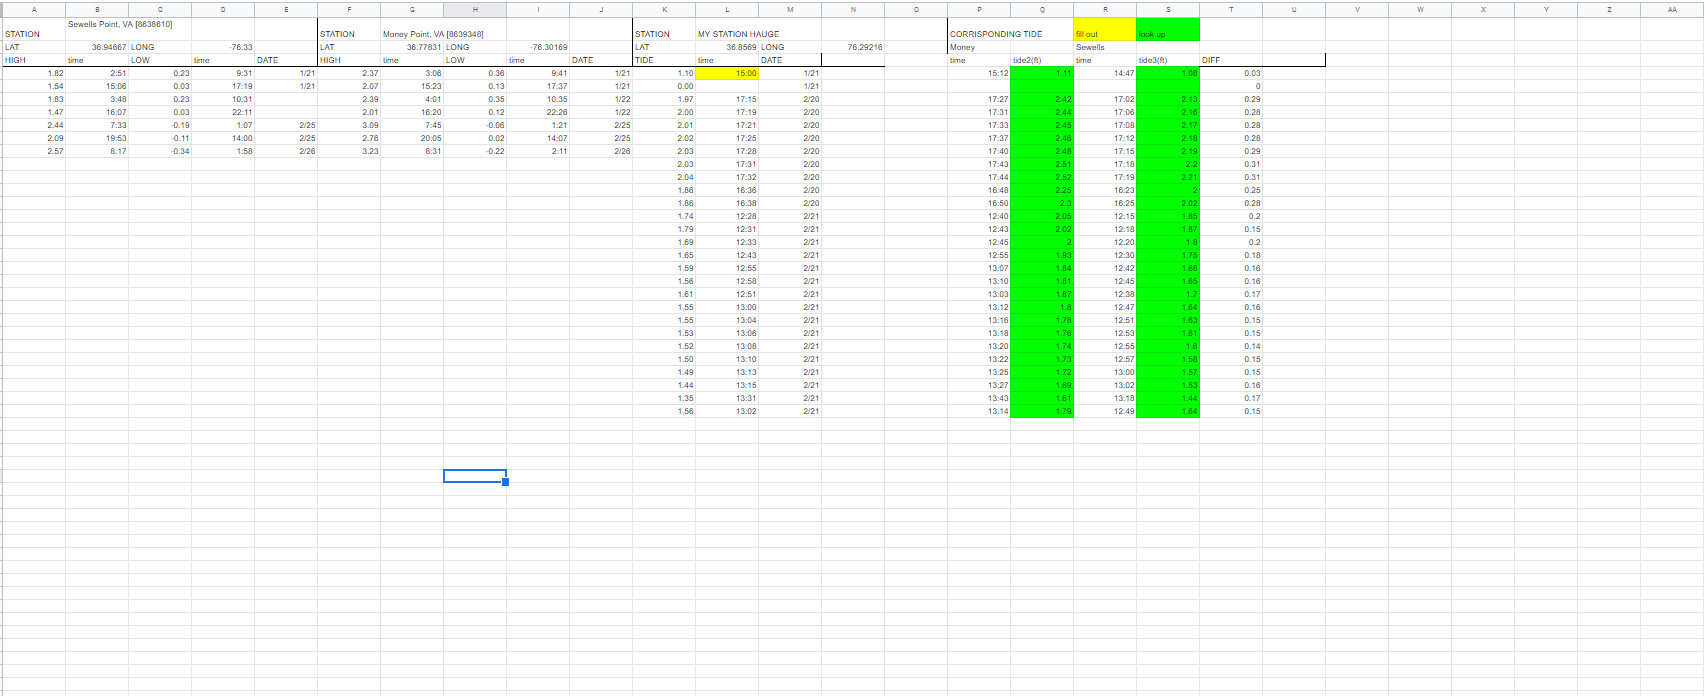
Tide (vertical)
But what about the tides? Spreadsheet and how did I come up with the tide info. The issues with it as well. My largest error bar

Geodesy
I feel I must say that I know this might be cheating but I did not have the time to do this math over and over again. So I learned how to find the LAT/LONG of something based upon the distance and bearing. I then slapped that math into a script in python and had myself a way to check points and to find the corner lat/long of my map. It is by no means a GREAT script, but it is my script and I am proud of it. Github

Cartography
The final product
